Free Gantt Chart Template for Google Sheets [Sheets / XLSX]
Are you looking for a Gantt chart template for Google Sheets? It's good to see you here, you've come to the right place.
Managing creative projects involves handling multiple complex tasks, client feedback rounds, design revisions, and tight deadlines simultaneously. Keeping everything organized becomes extremely challenging when numerous things are happening simultaneously. That's where a well-designed Gantt chart template for Google Sheets comes in handy.
In this article, you'll learn what makes a great Gantt chart for designers, how to set up your template in Google Sheets, and discover automation tricks that will save you hours each week.
What is a Gantt Chart?
A Gantt chart is a visual project management tool that shows tasks, timelines, and dependencies on a horizontal bar chart. Think of it as a project framework that everyone can understand at a glance.
What Are the Benefits of Using a Gantt Chart?
For creative agencies, Gantt charts solve several common problems:
- Timeline visibility. Instead of wondering "When is the logo due?" or "Are we on track for launch?", everyone can see exactly what's happening as it happens.
- Resource planning. You can spot when your designers are overbooked or when you need to bring in freelancers before it becomes a crisis. For example, Flowspark uses the client portal and client requests feature of ManyRequests to distribute work evenly among its account managers. This prevents any one person from getting overwhelmed with too many client projects at once.
- Client communication. Clients love seeing progress visually. It builds trust and reduces those "How's my project going?" emails.
- Dependency management. Creative work often involves sequential steps. You can't start coding a website before the designs are approved. Gantt charts help you map these connections.
The key difference between generic project management and creative work is the evolving nature. Creative projects often involve multiple feedback rounds, revisions, and approval stages, which standard templates frequently overlook.
How to Create Your Gantt Chart Template in Google Sheets
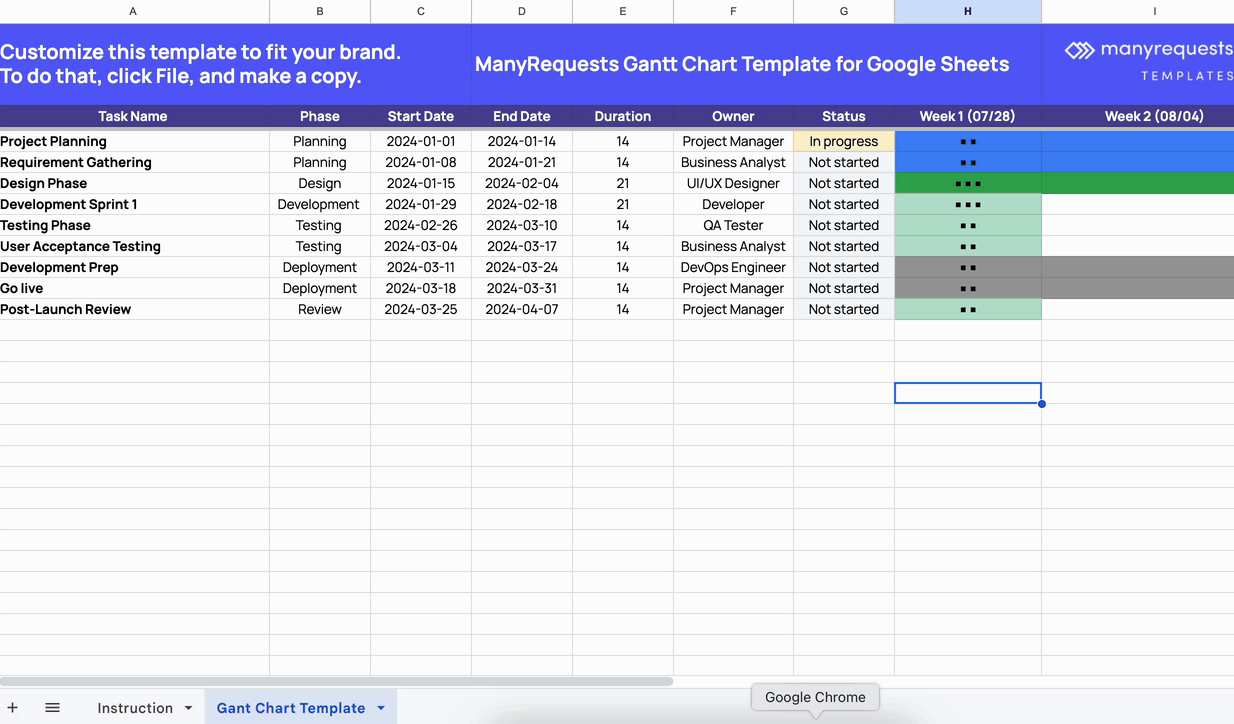
- Set up your basic structure. Start with a new Google Sheet and create these columns: Task Name, Start Date, End Date, Duration (Days), Assigned To, Status, and Phase. Your timeline will span across the top, with dates ranging from your project's start date to its end date.
- Add creative-specific task categories. Unlike generic templates, creative projects need specific task types. Include Discovery & Strategy Phase (client brief review, competitive analysis, strategy workshop, creative brief approval), Design Phase (concept development, design rounds, client feedback incorporation, final design approval), Production Phase (asset creation, content development, technical implementation, quality assurance), and Launch & Delivery (client presentation, file delivery, launch support, post-launch review).
- Build the visual timeline. Create your timeline grid by adding date headers across the top (daily, weekly, or monthly, depending on project length), using conditional formatting to color-code different phases, creating bars that show task duration using background colors, and adding progress indicators for completed tasks.
- Add formulas for automation. Smart formulas can save you tons of time. Use Duration Calculator: =DAYS(C2,B2) (End Date minus Start Date), Status Indicator with conditional formatting to turn cells red when tasks are overdue, yellow when due soon, and green when complete, and Progress Tracker: =COUNTIF(F:F,"Complete")/COUNTA(F:F)*100 to show overall project completion percentage.
ManyRequests offers a way to display project timelines within your client portal using Airtable's Gantt charts. This means your clients can see exactly when each part of their creative project will start and finish. They can track progress in real-time without needing to ask for updates. It's like giving your clients a window into your work schedule so they always know what's happening with their project.
What Happens When You Don't Use a Gantt Chart
- Missed deadlines. Tasks pile up without clear priorities, leading to last-minute rushes and disappointed clients. That website launch gets pushed back three times because nobody realized the copywriting was blocking development.
- Resource conflicts. Your star designer gets double-booked on two major projects. Now both clients are unhappy, and your team is stressed and overworked.
- Scope creep. Without clear task boundaries, clients demand "small changes" that become major revisions. What started as a logo design became a complete rebrand.
- Poor communication. Team members work in silos, not knowing what others are doing. The developer starts coding before the designs are finalized, wasting hours of work.
- Budget overruns. Without tracking time against tasks, projects drag on longer than estimated. Your profitable project becomes a money pit.
Tips and Best Practices for Creative Gantt Charts
- Don't reinvent the wheel for every project. Create master templates for common project types (website builds, brand launches, marketing campaigns) and customize from there.
- Creative work is unpredictable. Add 20-30% extra time for each phase to account for revisions, client delays, and unexpected challenges.
- Make it crystal clear when one team member finishes their part and passes it to the next person. Use status updates like "Ready for Review" or "Waiting for Client Approval."
- Create a client-facing version that shows only major milestones. They don't need to see every internal task, just the big picture and their required input dates.
- A creative project tracker is only useful if it's current. Set a weekly review time to update progress and adjust timelines as needed.
- Group related tasks into phases like "Discovery," "Design," "Development," and "Launch." This makes complex projects easier to understand.
Advanced Tips for Creative Teams
- Color-coding that works. Smart color choices make your project timeline easy to read at a glance. Use blue for planning and strategy work, green for design and creative tasks, orange when clients need to review something, and purple for building and production work. Always mark urgent or late items in red so they stand out immediately.
- Handling feedback rounds. Creative projects need time for back-and-forth conversations with clients. Plan for this by adding steps like showing the first concept, getting feedback, making changes, getting more feedback, and final approval. Give yourself extra time between each step because feedback always takes longer than expected.
- Client-facing versions. Make a simple version of your timeline just for clients to see. Show them only the big moments, like when they'll see designs, when they need to approve, and when the final work gets delivered. Also, mark when you need something from them. This keeps them in the loop without confusing them with too many details.
- Automation with conditional formatting. Set up your system to change colors automatically based on what's happening. Late tasks turn red, tasks due soon turn yellow, and finished tasks turn green. Client-interactive tasks can also be displayed specially. This helps you see problems quickly before they get worse.
Frequently Asked Questions
How do I make a Gantt chart in Google Sheets for free?
You can create a basic Google Sheets Gantt chart using Google Sheets' built-in features. Set up columns for tasks, dates, and duration, then use conditional formatting and background colors to create the visual timeline bars. While it takes some setup, it's completely free and shareable with your team.
What's the difference between a creative agency's Gantt chart and a regular one?
Creative agency Gantt charts need to account for iterative work, multiple feedback rounds, and approval gates. They typically include phases for concept development, design rounds, client feedback, and revisions that generic templates miss.
Conclusion
While a Gantt chart template for Google Sheets provides excellent project visibility for new agencies, it becomes increasingly time-consuming as you scale. Manual updates, lack of automated client communication, and poor tool integration mean you're rebuilding project management systems repeatedly rather than focusing on client work.
At ManyRequests, we've built a solution that eliminates this overhead by combining built-in Gantt functionality with automated client portals, streamlined feedback collection, and integrated file sharing.
Ready to see how much easier project management can be? Start your 14-day free trial with ManyRequests and discover why hundreds of creative agencies have made the switch from spreadsheets to streamlined workflows.

.svg)