Free Sales Report Template [Sheets / XLSX]
Running a creative agency shouldn't mean flying blind when it comes to sales. You're sending proposals and taking calls, but without the right sales report template, you have no idea what's working. Most reporting tools cater to product companies, not agencies managing client retainers.

This guide shows you how to build a sales report template that actually works for agencies. You'll learn which agency performance metrics matter most, how to track them, and get a free template you can use today.
Why creative agencies need specialized sales reports
Generic sales reports don't work for creative agencies because they can't distinguish between retainer income and project fees. They miss essential numbers like average project size, which services sell best, or how much clients spend over time. They also ignore the fact that agency sales cycles take longer than typical product sales.
Agency sales are different because you're building relationships rather than making quick transactions, while juggling retainer contracts, one-time projects, and other pricing models, tracking recurring revenue, and keeping clients long-term matter more than anything else.
Effective sales reporting makes better decisions about pricing and growth.
The differences between generic and agency-specific reporting are vast. Here is a side-by-side comparison of what matters:
Generic Sales Report vs. Creative Agency Sales Report
So what exactly should you be tracking?
Understanding why agencies need specialized reporting is only the first step– now let's break down the specific numbers that drive better decisions.
Here are the essential metrics that separate effective agency reporting from generic sales dashboards.
Agency sales report metrics you should include
Effective sales reporting starts with tracking the right KPIs for the creative agency. Unlike generic sales metrics, these indicators are for longer sales cycles, mixed revenue streams, and relationship-based selling.
Pipeline Metrics
- Total pipeline value (the aggregated value of all active opportunities)
- Opportunities by stage (breakdown of prospects in discovery, proposal, negotiation, and closed)
- Pipeline velocity (how quickly deals move through stages)
Since agencies often have longer sales cycles, tracking opportunities by stage and pipeline velocity is vital for managing expectations and planning effectively.
Conversion Metrics
- Lead-to-opportunity conversion rate (percentage of leads that become qualified opportunities)
- Proposal-to-client conversion rate or win rate (proportion of proposals that convert to clients)
- Average time to close or sales cycle length
These metrics help identify bottlenecks in your sales process. You can improve win rates by refining your approach using insights from our creative agency pitch deck guide.
Revenue Metrics
- New client revenue, existing client revenue (upsells and retainers)
- Revenue by service type (branding, web design, content)
- Monthly Recurring Revenue (MRR) vs. project-based revenue
- Forecast vs. actual revenue
The distinction between MRR and project revenue helps manage cash flow volatility. Forecast accuracy enables proactive adjustments to sales efforts, supporting the financial planning in your creative agency business.
Client Acquisition Metrics
- The number of new clients acquired
- Average deal size
- Cost per acquisition (CPA)
- Client source/channel.
These metrics directly inform ROI on business development efforts. Understanding client sources ensures you focus on channels that deliver the best results, aligning with your agency's pricing models.
Magier demonstrates the power of systematically tracking client acquisition with ManyRequests. As their business grew, they managed new client acquisition and service delivery workflows, enabling them to scale from a startup to 50+ businesses while maintaining quality.
Performance Analysis
- Win/loss ratio by service type
- Lost opportunities and reasons why
- Sales rep performance
These metrics drive continuous improvement and strategy refinement. Review these monthly to identify patterns and adjust your sales approach before minor issues become costly trends.
How to build your sales report
Now that you know which metrics matter, here's your step-by-step process for building a reporting system that consistently and accurately captures these insights:
Choose your reporting period.
Select a reporting cycle that best suits your needs: weekly for active pipeline management, monthly for performance reviews and forecasting, quarterly for strategic planning and trend analysis, and annually for year-over-year growth tracking.
Set up your data sources.
Organize your data effectively, including CRM systems (HubSpot, Pipedrive), proposal tools, accounting/invoicing software, and spreadsheets if needed. ManyRequests can centralize these data streams into a single dashboard, automating consolidation and reducing manual effort.
Define your sales stages.
Map out your sales pipeline to reflect your process: lead captured, discovery call scheduled, proposal sent, negotiation, and won/lost. Customize based on your workflow, but ensure the stages clearly map the customer journey.
Establish your baseline metrics.
Review historical data from the past 6-12 months, calculate average conversion rates at each stage, determine typical sales cycle length, and set realistic benchmarks. Without understanding your current performance, you can't measure improvement or identify which changes actually move the needle for your agency.
Create your dashboard.
Create your agency revenue dashboard with month-over-month comparisons, year-over-year growth indicators, and service-line breakdowns. Starting from free templates can accelerate setup and ensure coverage of essential KPIs.
Schedule regular reviews.
Set up recurring check-ins: weekly pipeline reviews with the BD team, monthly performance analysis with leadership, and quarterly strategic adjustments. This rhythm creates accountability and enables timely identification of challenges.
Using your sales report to drive agency growth
Building the report is just the beginning; the real value comes from turning these insights into action. Here's how to use your sales data to accelerate agency growth:
Identify your best-performing services.
Track which services have the highest conversion rates and analyze revenue per service type. Double down on high performers and consider sunsetting low performers that drain resources. This focus allows you to refine your positioning, train your team more effectively, and attract clients who are the best fit for your agency's strengths.
Shorten your sales cycle.
Identify where prospects get stuck, streamline your proposal process, and proactively address common objections. Use data to refine your agency's sales presentation materials. Even reducing your average sales cycle by a week can significantly increase your annual revenue capacity and improve cash flow.
Improve your win rate.
Analyze lost opportunities for patterns, review winning proposals for best practices, better qualify leads, and adjust pricing based on your rate card strategy. A 10% improvement in win rate can have the same impact as generating 10% more leads, but with far less effort and cost.
Forecast more accurately.
Use historical conversion rates as baselines, apply weighted forecasting by pipeline stage, and plan hiring based on projected revenue. Accurate forecasting prevents costly mistakes, such as hiring too early or turning away work because you're understaffed.
Make data-driven decisions.
Move beyond gut feelings by using reports to guide strategic planning. Share insights across your team and create accountability by guiding actions with data. When your entire team understands the numbers, everyone can contribute to improving performance and take ownership of agency growth.
Even with the proper framework in place, many agencies undermine their reporting efforts with preventable mistakes. You can have all the right metrics and a solid reporting process, but these five issues will sabotage your results if left unchecked.
Watch out for these common pitfalls.
Common sales reporting mistakes agencies make (and how to avoid them)
Tracking vanity metrics.
Avoid tracking vanity metrics as total leads if few convert. Focus on actionable metrics such as qualified opportunities, conversion rates, and revenue generated. If a metric doesn't help you make better business decisions or allocate resources more effectively, remove it from your dashboard.
Inconsistent data entry.
Establish transparent processes for updating CRM records and train your team on best practices to ensure accurate and up-to-date information. Consistent sales tracking for agencies requires regular audits to ensure data reliability and effective revenue reporting. Set up automated reminders or incorporate CRM updates into your team's weekly routine to ensure data quality is maintained.
Reporting without action.
Reports must drive decisions, not just inform. Schedule review meetings with specific action items and use reports to highlight recommendations. Assign owners to each insight and set deadlines for follow-up actions so your reporting translates directly into business improvements.
Overcomplicating the report.
Start simple with 5-7 core metrics. Prioritize metrics that inform decisions, such as pipeline value, conversion rates, and revenue by service line. You can always add complexity later once your team has mastered the fundamentals and consistently uses the basic reports.
Not differentiating revenue types.
Separate project from retainer revenue clearly. Track one-time and recurring revenue separately to support accurate forecasting. This distinction helps you understand business stability, making it easier to predict cash flow and develop growth strategies.
Conclusion
Good agency sales reporting helps you grow your business the right way. Don't try to track everything, just focus on what matters. When you know which services sell best, how long deals take, and where your money comes from, you can make smart decisions instead of guessing.
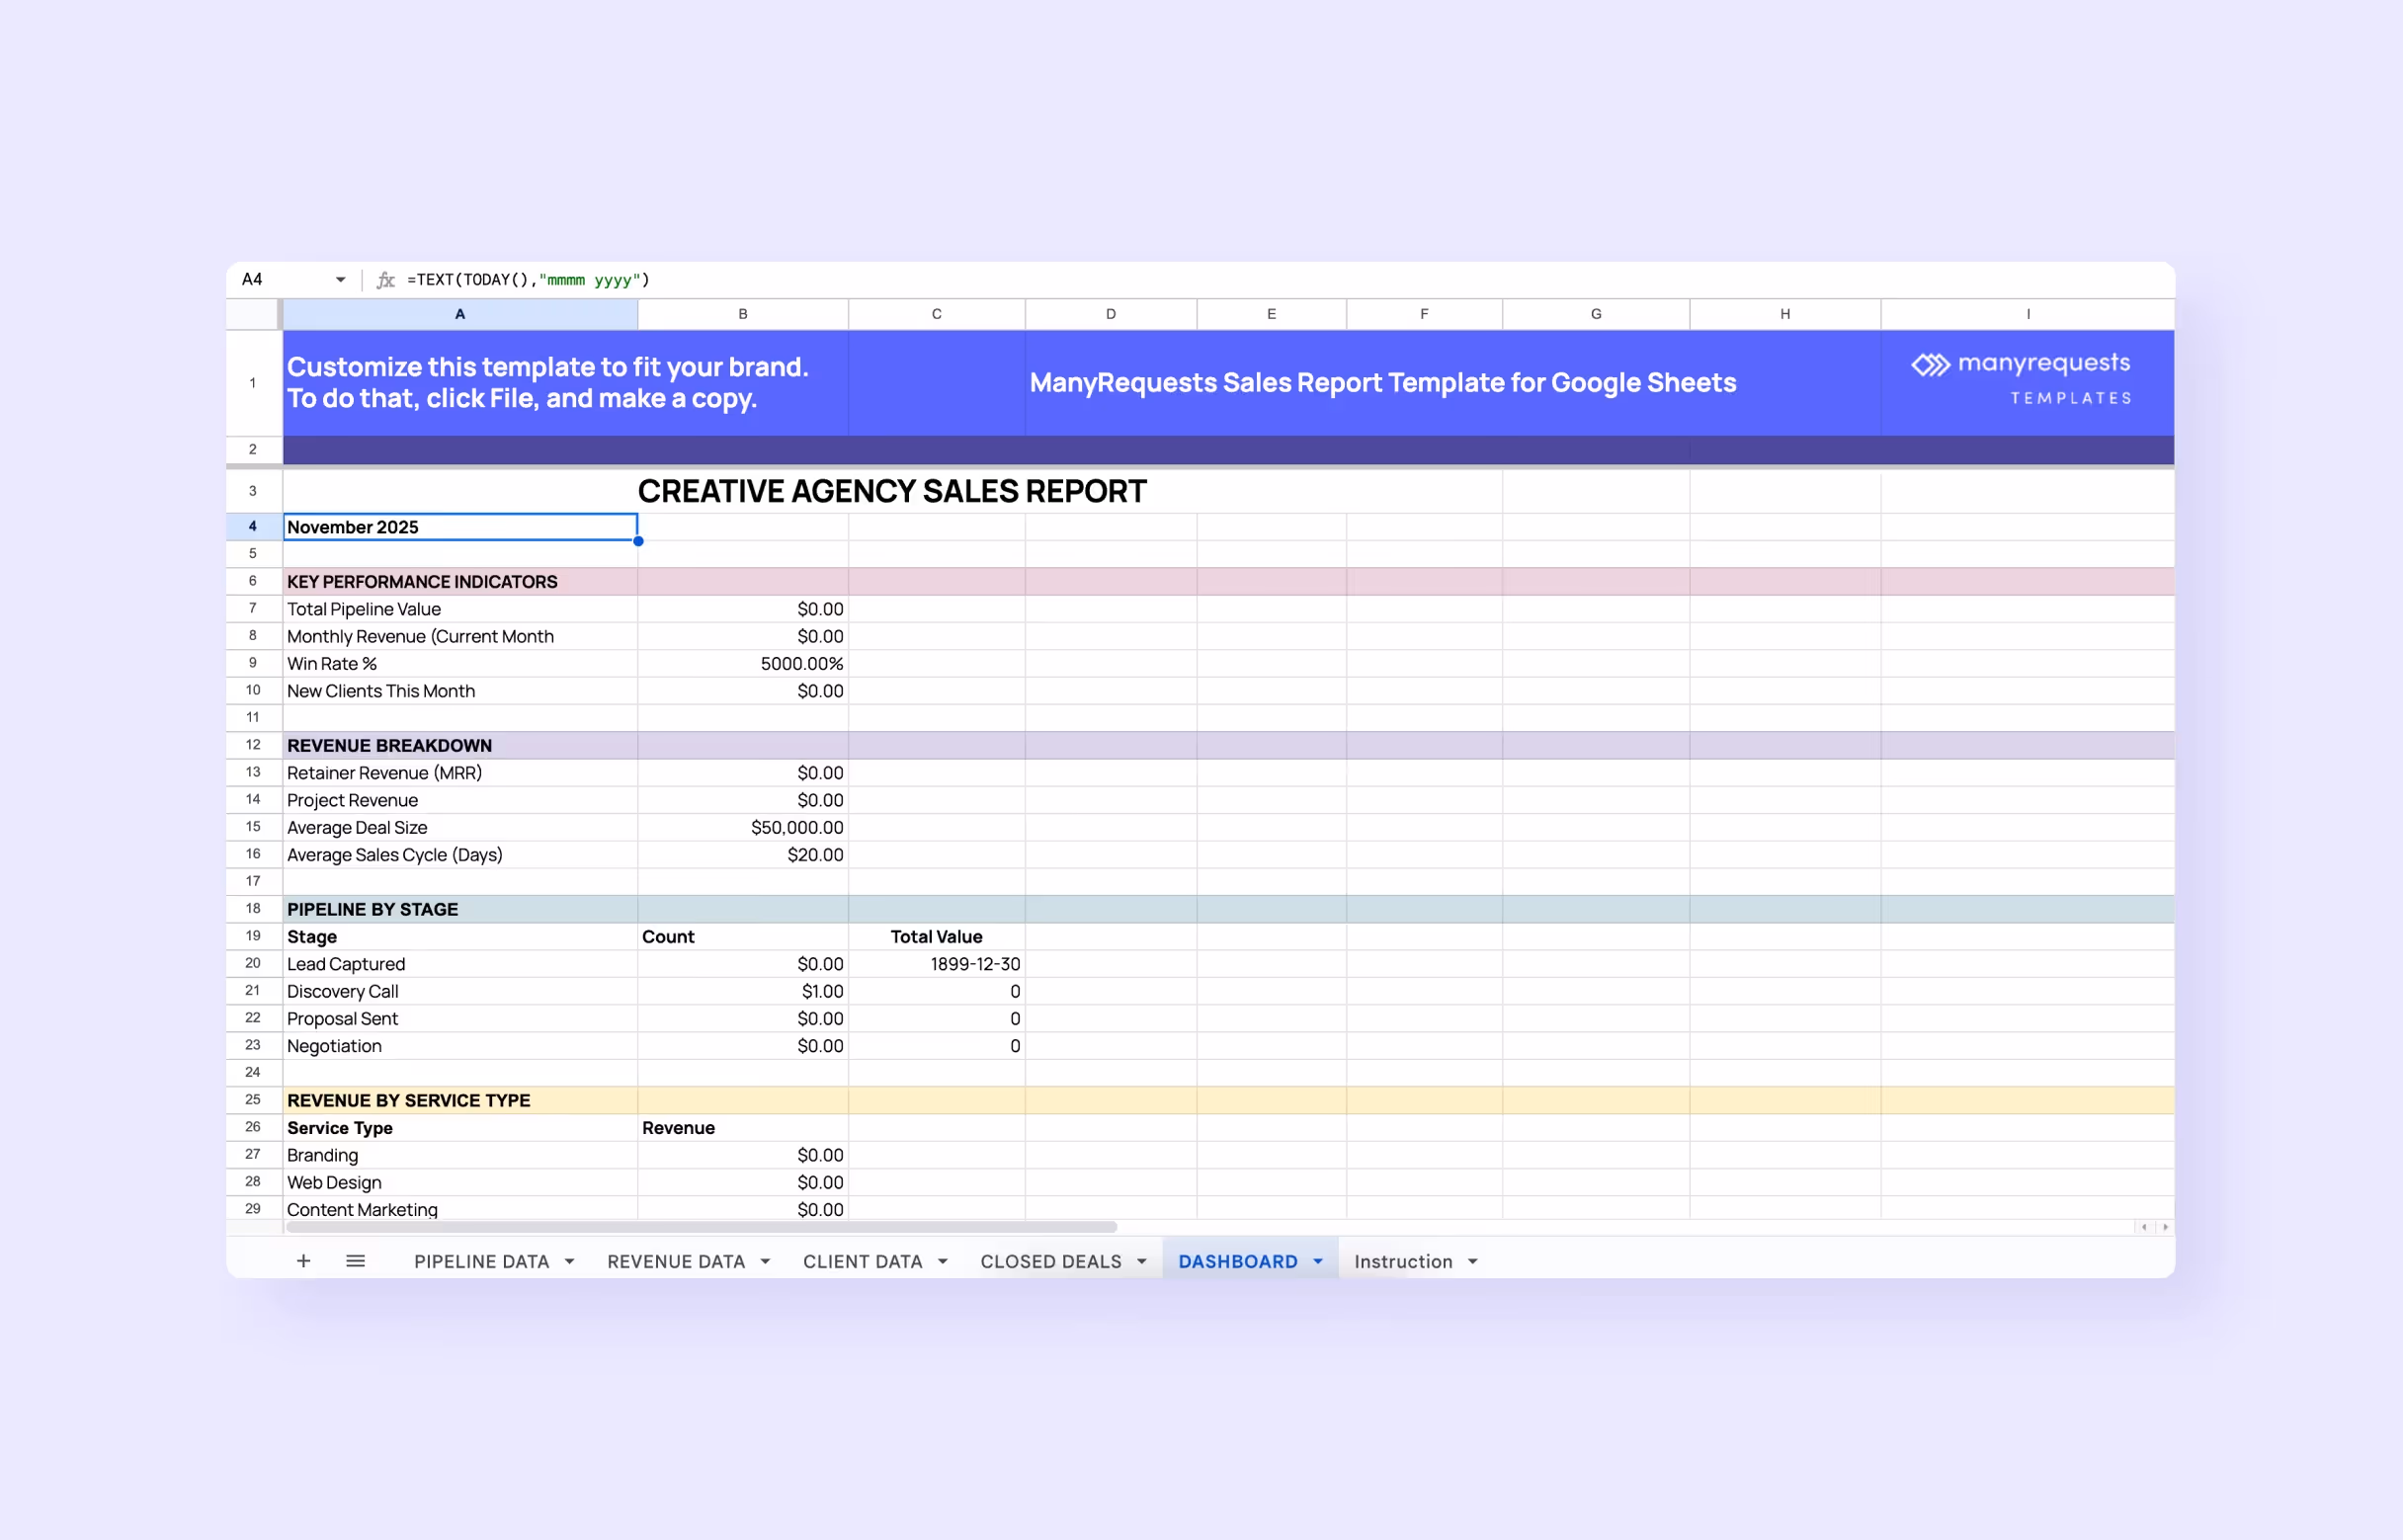
Spreadsheets are perfect for getting started– download our free sales report template with ready-made formulas, a revenue dashboard, and monthly and quarterly views for Google Sheets or Excel.
Manual tracking, however, has its limits.
Try ManyRequests for 14 days free; it automatically connects your sales to your projects, helping data-driven agencies grow faster.
FAQ
How do I write a sales report?
Start by choosing your reporting period (weekly, monthly, or quarterly). Gather data from your CRM, proposals, and invoicing software. Include key metrics like pipeline value, new clients, conversion rates, revenue by service type, and won/lost deals. Use our free sales report template for agencies to get started—it has all the formulas built in.
How to prepare a sales report in Excel?
Open Excel or Google Sheets and create columns for date, lead source, opportunity value, sales stage, service type, and status. Set up separate sheets for your dashboard, raw data, and monthly summaries. Use formulas such as SUM, AVERAGE, and COUNTIF to calculate totals automatically.
What is included in a detailed sales report?
A detailed agency sales report includes pipeline metrics (total value and opportunities by stage), conversion metrics (win rates and sales cycle length), revenue metrics (new client revenue, retainer vs. project revenue, revenue by service type), and client acquisition data (new clients and average deal size). It should also track win/loss analysis and compare current performance to previous periods.

.svg)